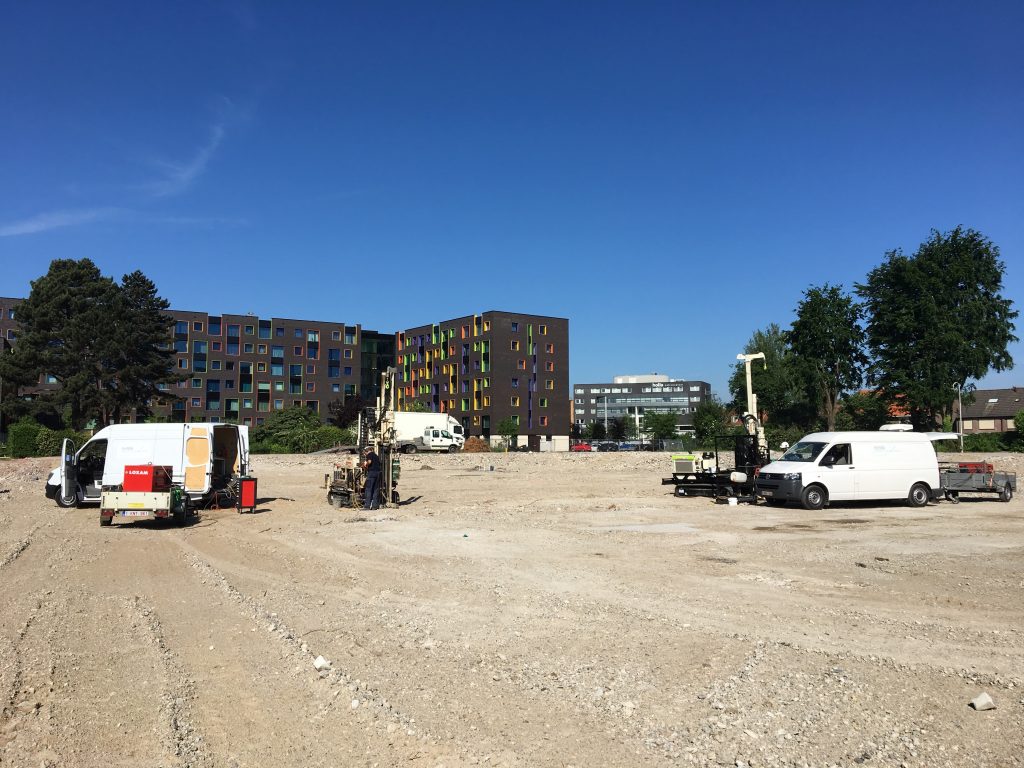
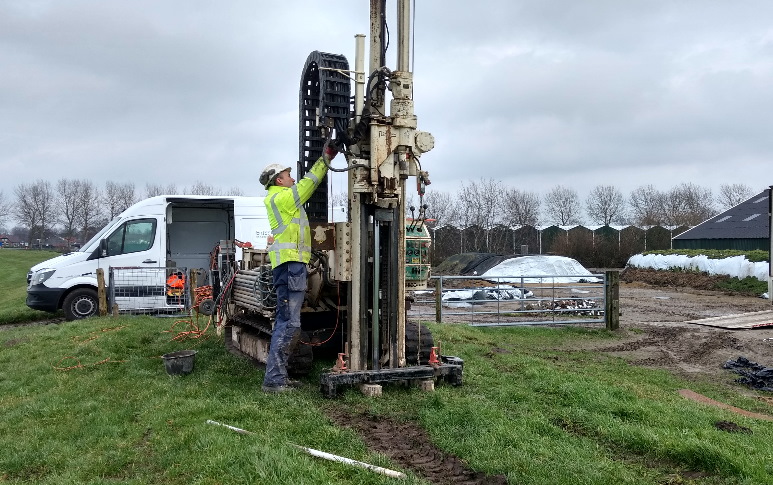
MIP measurements with compact Geoprobe make indoor HRSC investigation possible at locations with limited space.
EnISSA can deploy high-resolution measurements to provide you with key insights into the variation of subsurface soil characteristics. We can carry out Hydrogeologic characterization in combination with MIP or OIP measurements in environmental investigations or as dedicated tool in groundwater or geotechnical investigations.
We perform such investigations by inserting a probe into the subsurface and creating a depth profile of the signals produced by one or more of the following sensors.
Lorem ipsum dolor sit amet, consectetur adipiscing elit. Ut elit tellus, luctus nec ullamcorper mattis, pulvinar dapibus leo.
Lorem ipsum dolor sit amet, consectetur adipiscing elit. Ut elit tellus, luctus nec ullamcorper mattis, pulvinar dapibus leo.
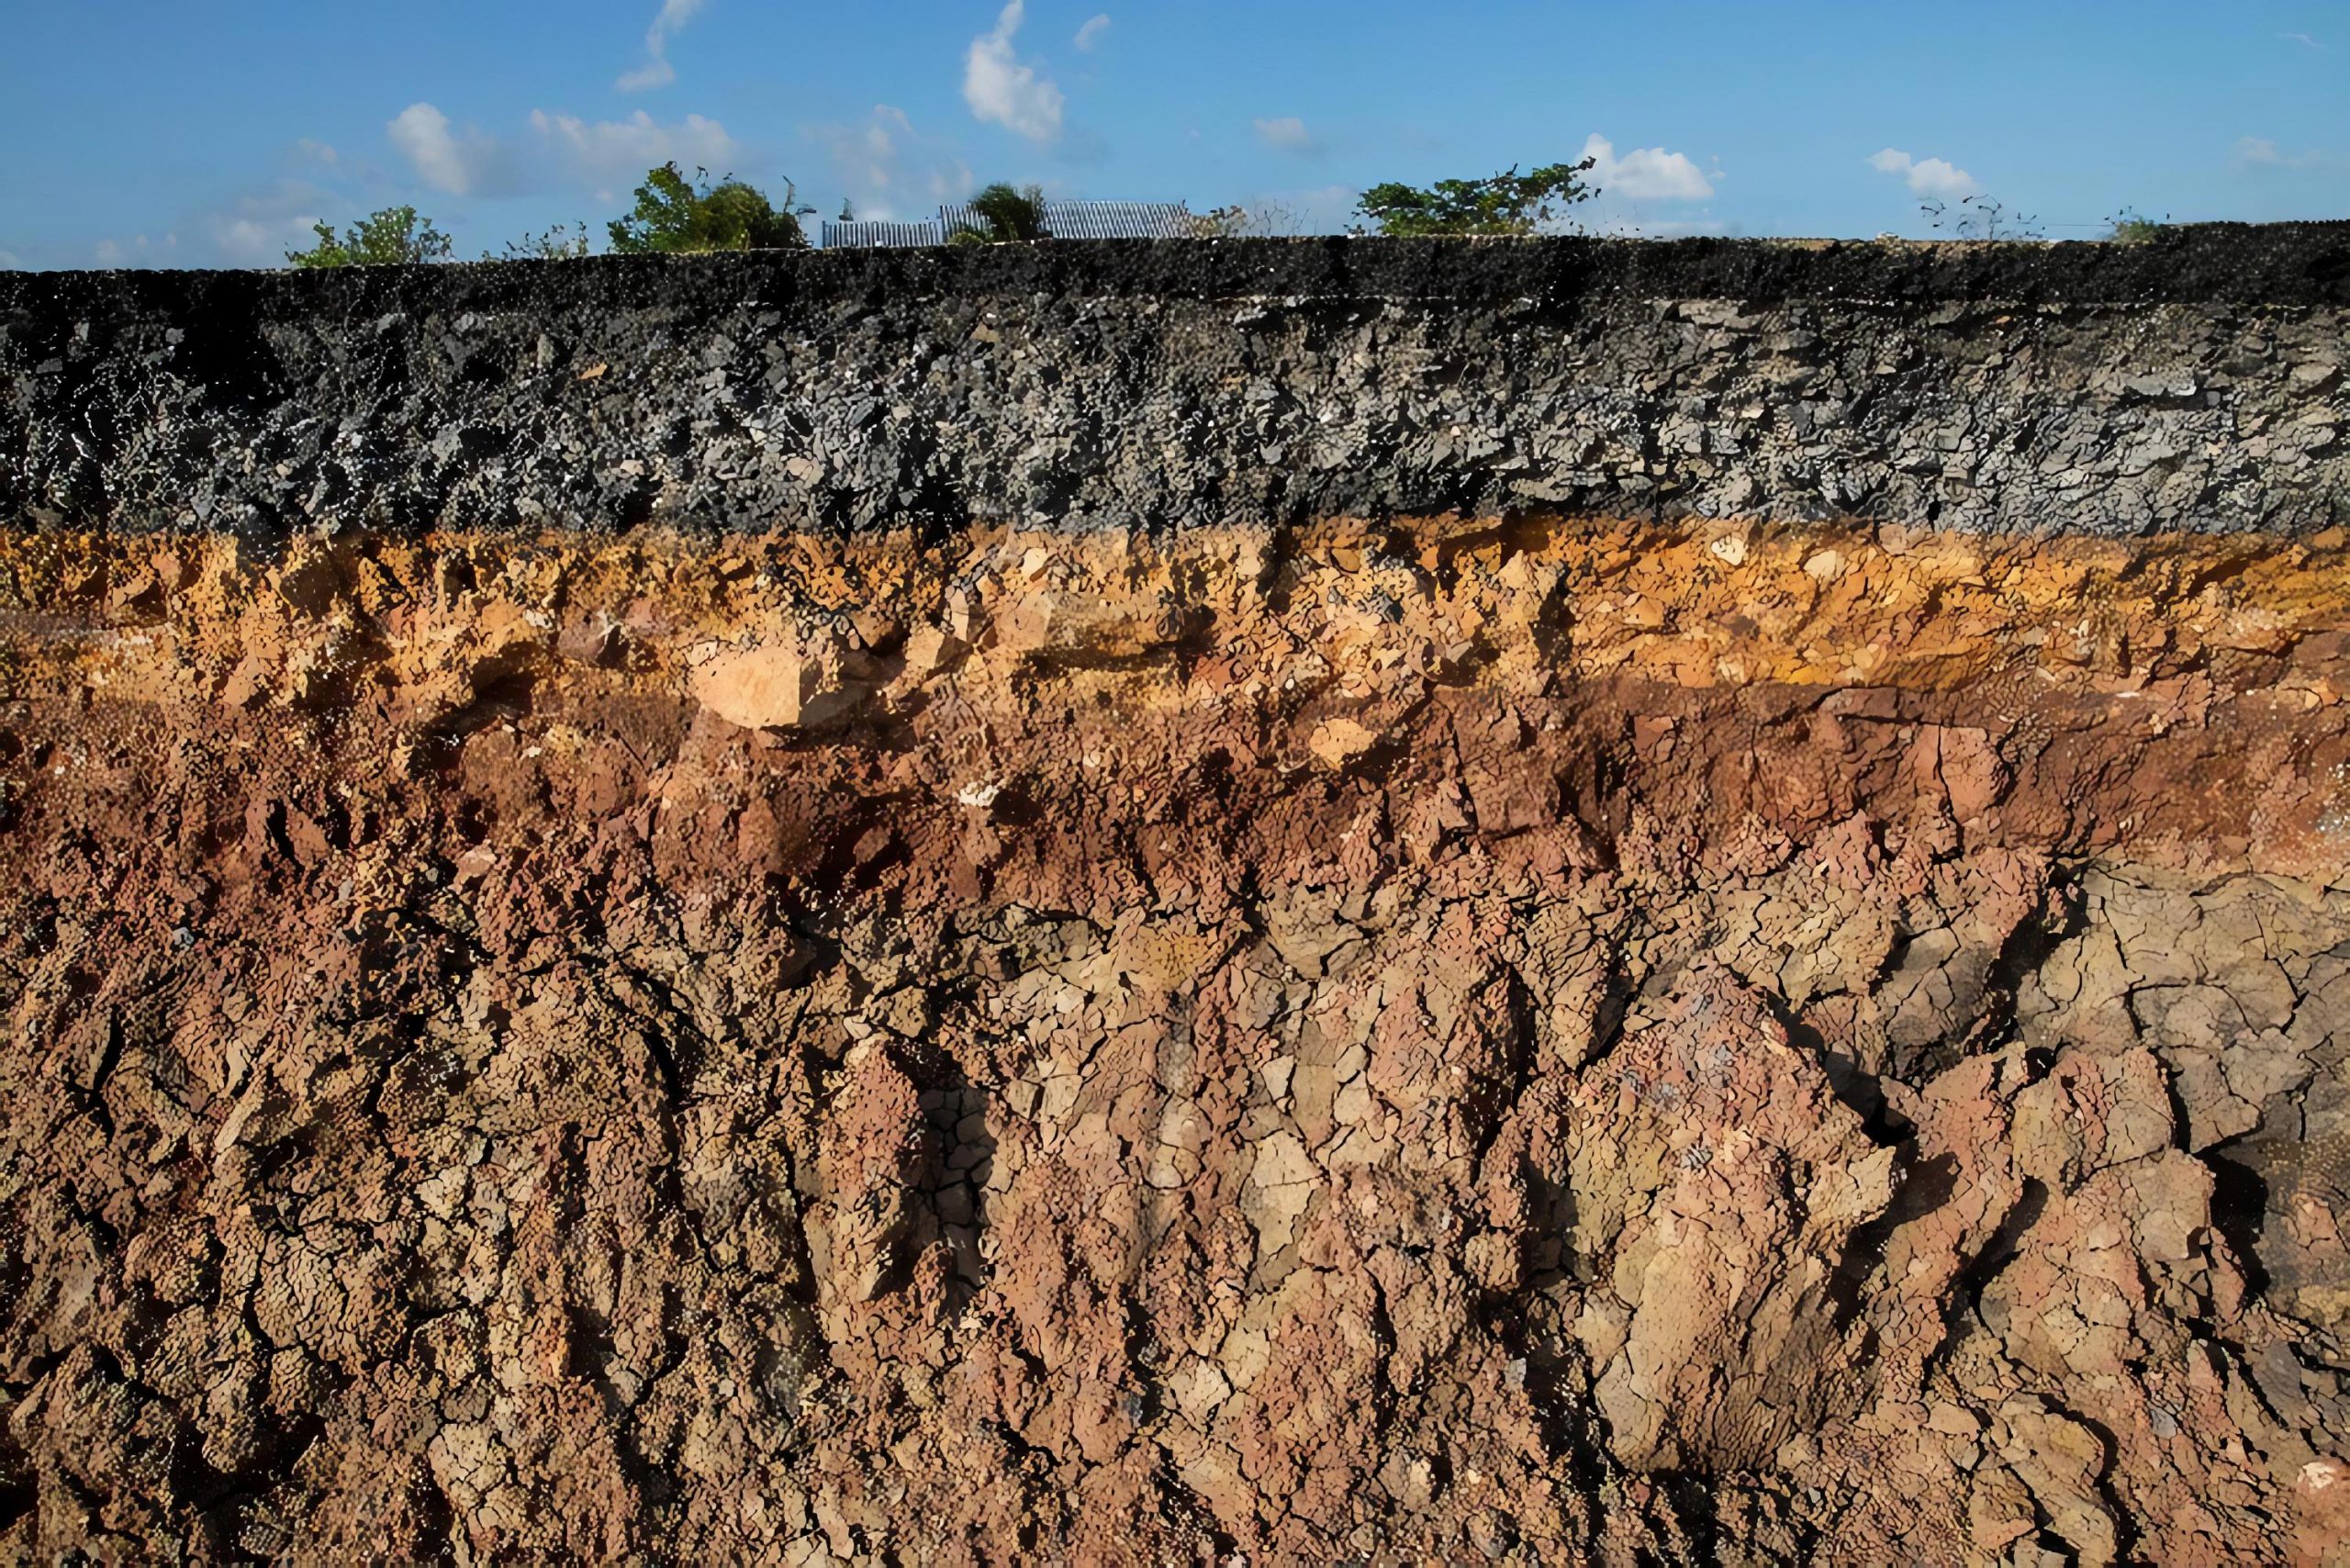
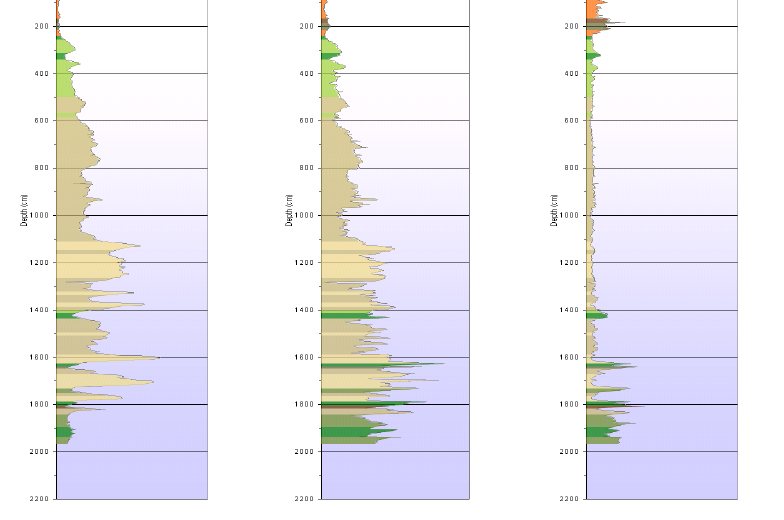
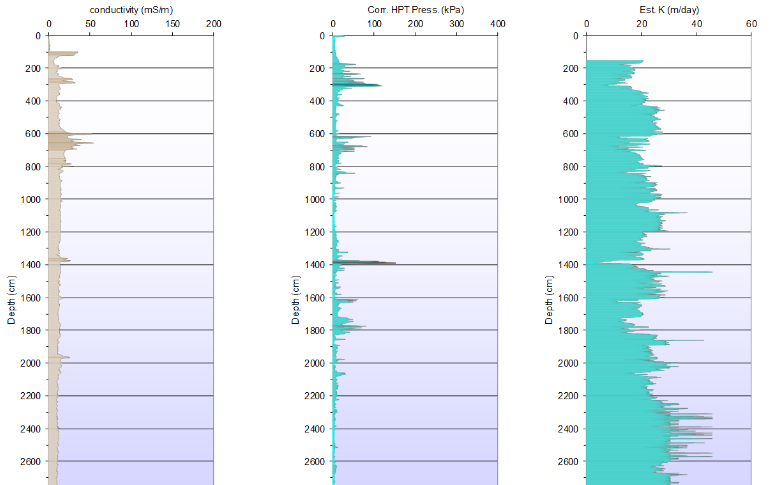
On the basis of EC measurements, we acquire insight into soil structure variations. An EC profile displays the various soil layers. We measure the electric conductivity of the soil using a probe with an integrated EC dipole. The EC signal is in part related to the granular size of the soil particles, which tells us a great deal about the soil structure. In general, sand particles have low EC, while clay particles tend to produce high EC signals.
We use the Hydraulic Profiling Tool (HPT) to collect data about soil permeability. We insert a probe into the ground and with a regulated flow rate pump we inject a constant water flow. The applied injection pressure is recorded and displayed according to depth.
An increase in injection pressure represents the layers where the soil is less permeable A decrease in pressure then displays the permeable layers. With the injection pressure and flow the estimated conductivity (K [m/day]) is calculated on the basis of an empirical model.
The Cone Penetrometer Test (CPT) derives its origin from geotechnical engineering. A CPT cone is pushed into the ground at constant speed by a heavy push truck or a more compact Geoprobe that is anchored into the ground. This probe measures two components:
On the basis of the probe’s measurements, we can classify the soil layers into 12 categories, thus creating an accurate image of the soil. For example, sandy soil typically has a high point resistance and a lower friction resistance. By contrast, clay soil has low point resistance and high friction resistance.
If, in addition to the measurement data produced by such an investigation, you would also like a comprehensive 3D visualisation, we are pleased to be of assistance to you! This makes it easier to clearly display the results of the investigation for discussion with all involved parties.

Lorem ipsum dolor sit amet, consectetur adipiscing elit. Ut elit tellus, luctus nec ullamcorper mattis, pulvinar dapibus leo.Lorem ipsum dolor sit amet, consectetur adipiscing elit. Ut elit tellus, luctus nec ullamcorper mattis, pulvinar dapibus leo.Lorem ipsum dolor sit amet, consectetur adipiscing elit. Ut elit tellus, luctus nec ullamcorper mattis, pulvinar dapibus leo.Lorem ipsum dolor sit amet, consectetur adipiscing elit. Ut elit tellus, luctus nec ullamcorper mattis, pulvinar dapibus leo.Lorem ipsum dolor sit amet, consectetur adipiscing elit. Ut elit tellus, luctus nec ullamcorper mattis, pulvinar dapibus leo.Lorem ipsum dolor sit amet, consectetur adipiscing elit. Ut elit tellus, luctus nec ullamcorper mattis, pulvinar dapibus leo.

Lorem ipsum dolor sit amet, consectetur adipiscing elit. Ut elit tellus, luctus nec ullamcorper mattis, pulvinar dapibus leo.Lorem ipsum dolor sit amet, consectetur adipiscing elit. Ut elit tellus, luctus nec ullamcorper mattis, pulvinar dapibus leo.Lorem ipsum dolor sit amet, consectetur adipiscing elit. Ut elit tellus, luctus nec ullamcorper mattis, pulvinar dapibus leo.Lorem ipsum dolor sit amet, consectetur adipiscing elit. Ut elit tellus, luctus nec ullamcorper mattis, pulvinar dapibus leo.Lorem ipsum dolor sit amet, consectetur adipiscing elit.
De gedetailleerde compound specifieke MIP-profielen maken we voor onze klanten heel visueel. Soms zelfs ook in 3D. Dit helpt hen in hun adviesrol naar klanten toe om de situatie van de verontreiniging helder te illustreren.
We kunnen dus stellen dat deze methodiek uiterst betrouwbare informatie oplevert, wat adviseurs helpt bij het opmaken van het CSM en wat op zijn beurt weer leidt tot een geslaagd saneringsproject in the end.