3D Visualisation: making data visually insightful​​

Through HRSC investigations, we gather extensive information on the soil and 
contaminants. 3D visualization tools provide significant added value
in working with results from methods such as EnISSA MIP-GCMS or OIP. Clear visualizations are crucial for understanding the data and explaining complex geological findings to clients or other stakeholders.

Our visualization experts can create 3D visualizations of measurement data that
include both contamination parameters and soil properties. Additionally, we
can integrate results from previous soil investigations into these 3D
visualizations. This can be useful, for instance, in preparing for your
HRSC project or evaluating existing datasets.

Want to know more about the available options?

Projects

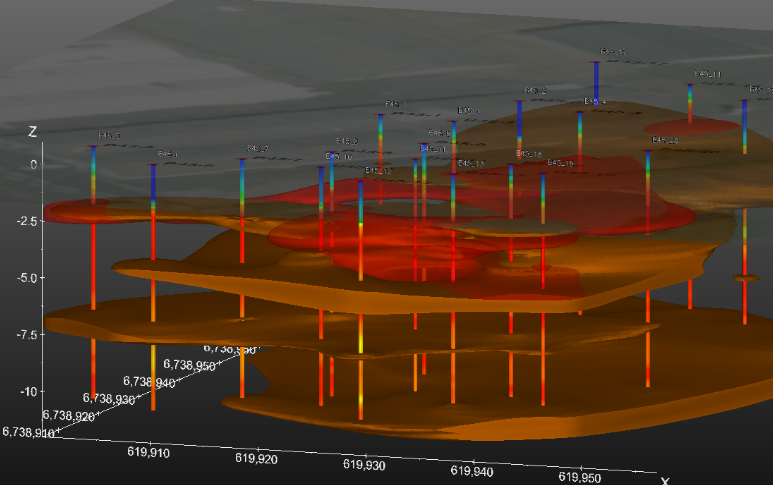
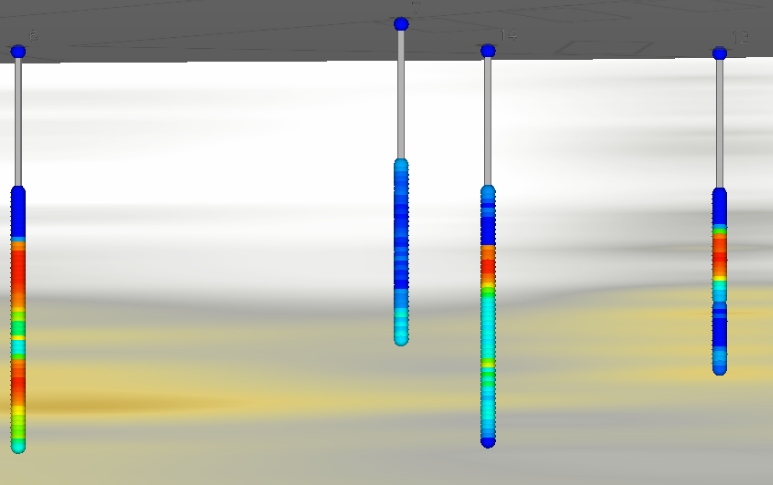
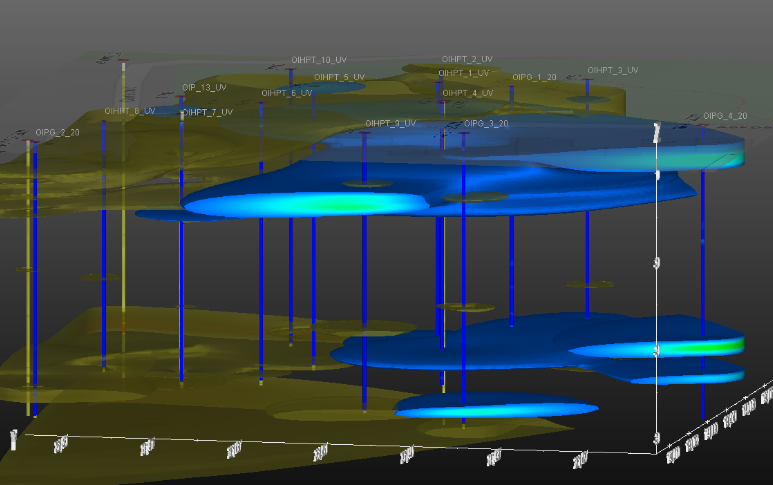
How does PFAS migrate through a complex subsurface? Using high-resolution EC-HPT soundings, our team in Gavere identified permeability contrasts and key stratigraphic transitions in detail. This knowledge underpins targeted sampling, improved monitoring and a realistic assessment of PFAS mobility.
Redeveloping former dry cleaning sites requires certainty about what lies beneath the surface. Using high-resolution site characterisation (HRSC), we map historical chlorinated solvent contamination accurately, even in hard-to-access urban locations. This creates a solid basis for well-informed remediation and viable redevelopment.
On an active production site, we conducted a high-resolution subsurface investigation to precisely identify source zones and contaminant behaviour. By applying HRSC techniques, chemical and geological data were integrated into one coherent model. The results directly supported targeted optimisation of the existing Pump & Treat system.