A residential area in the Limburg region is located on a former gas plant site. The site was transformed into a residential area after the plant closure and it became apparent that the soil was contaminated with tar as a result of its former use.
As with other DNAPLs, the contamination has a complex distribution in soil and groundwater. Tar can sink to the water table, with the migration being strongly determined by differences in soil structure.
High density of OIP measurements reduce data gaps in the CSM
The soil structure is extremely heterogeneous at this project site, because of a diversity of loam and sand layers. It is extremely difficult to obtain the necessary data density to build a sound CSM with traditional soil and groundwater sampling. Moreover, this concerns specific contamination mainly with heavy PAH components. We were contracted by Witteveen+Bos to conduct 3 soundings using the Optical Image Profiler.
This method’s high measurement resolution enabled us to provide a fast and cost-efficient indication of how the contamination had migrated in relation to the soil structure. Objective: use a limited survey of no more than 1 day to confirm and supplement the existing CSM.
Results of limited survey:
- We carried out the first sounding in the suspected source zone, where we saw high fluorescence signals that started in the unsaturated zone and reached up to 5 metres below ground level.
- Outside the source zone, in the presumed groundwater flow direction to the south, we detected tar in the saturated zone from 3 to 6 metres below ground level.
- In the third location further downstream, we found high fluorescence signals at around 6.5 metres below ground level, in only six images. This means that in this area the contamination only occurs in a thin soil layer of just 10 cm.
Detailed information offers insight into soil status and distribution of tar
If we compare the green fluorescence diagram with the brown EC diagram, we can see that the tar is clearly present in the more permeable soil layers (low EC signals).
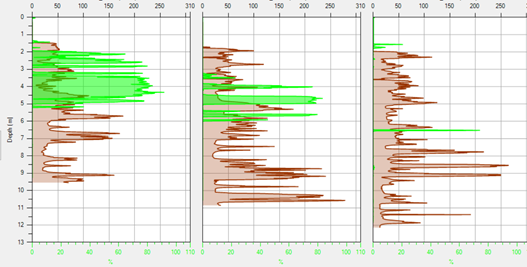
It is clear from the EC diagram that the soil structure is extremely heterogeneous. The product spreads by flowing through the clay layers and migrating deeper through the holes in these layers. A consequence is that the contamination does not necessarily spread with the groundwater flow direction but is largely determined by clay layer orientation.
A high measurement resolution enables you to measure the entire profile and determine in more detail how the product migrates and at what depths this can lead to groundwater contamination. Clear insight into the contamination situation is essential for an accurate risk evaluation and an effective remediation strategy.
If you’d like to know more about our methods or approach, please don’t hesitate to contact us.